Blue Mug Research : Embedded Linux Performance Study
November, 2002
© Copyright Blue Mug, Inc. 2002
Abstract
This study provides objective data on Linux's performance on embedded
hardware. We hope to help answer the question, ``is Linux the right
choice for my device?'' We have picked three representative embedded
device profiles - set-top appliances (personal video recorders,
web/mail appliances), handheld devices, and mobile phones - for
vertical analysis. This is the first part of a three part series, and
covers the first of these cases: the set-top device.
Please feel free to send us corrections, additions, or any general
comments to us at
perf-feedback@bluemug.com
Lately there has been a great deal of excitement generated over the use
of the Linux operating system on various embedded devices. The reasons
why Linux is a good idea for today's small devices are many and varied
(too much so, in fact, to be dealt with here: see http://www.linuxdevices.com
for more information). But along with the many benefits of Linux come
some uncertainties. Performance, in particular, crops up frequently as
a concern: embedded devices have limited hardware resources and the software
that they run must not over-tax those resources.
The concept of putting Linux in your PDA/phone/settop device appeared only
recently and no one really seems to know how well the OS will perform in such
limited environs. While you can read any number of reports of companies running
Linux on their device these reports rarely get specific about the hardware used
and performance achieved. Similarly, there are plenty of companies that will
sell you tools to "embed" Linux, but they don't provide much in the way of
performance data either.
We have undertaken this survey to provide you with objective analysis
that can alleviate some of the uncertainty surrounding putting Linux on an
embedded device. We can't, of course, tell you precisely how it will run
on your particular hardware and we won't pretend to. Instead, this survey
looks at a Linux performance on a series of different generic "devices"
which we refer to as profiles. Each profile matches a particular class of
embedded device like mobile phones, PDAs, or PVRs. We will tell you what
hardware we used, how we tested it, and what results we gathered in hopes
that these figures can give you a ballpark idea of how Linux might act on
your hardware.
This document provides a vertical survey of Linux performance. It will
give you the nitty-gritty for each of our device profiles but it will not
tell you how Linux matches up against another operating system on a
particular device. Comparisons like that are difficult to make accurately.
We seek only to provide you with information on what Linux can do.
We are assuming that if you are reading this, you are a technical manager
who is considering OS alternatives for a new device. You've heard of Linux
but you don't yet know everything about it. You know something about
operating systems in general, but you have yet to get your hands dirty
with this particular one. You also know something about embedded
systems and you have a sense of the unique challenges they present.
You are curious about how Linux can meet those challenges.
Blue Mug, Inc. is a small consulting company which specializes in embedded
software services. We have worked extensively with Linux and embedded
systems at both the kernel and application levels.
The first hurdle that we faced in measuring embedded Linux performance
was determining what to test and how to test it. The term "embedded"
describes a wide variety of devices and "Linux" encompasses a large set
of possible kernel configurations and patches (not to mention system
infrastructure and applications). We obviously could not cover all
possibilities, but we did want to address as many questions about Linux
as possible. To that end we took the following steps:
- Define Profiles
For the purposes of this study, we have identified two major device
categories (we call them profiles): the personal video recorder (PVR)
and the web/mail appliance (we give more specifics on each profile in its
section, below). At some later date we hope to publish data on two more
profiles: the handheld device and the mobile phone. By partitioning the
spectrum of embedded devices in this way we hope give you information on
Linux that is at least somewhat relevant to whatever specific device you
may be working on.
- Identify Profile-Specific Key Issues
For each profile we selected what we think are the most crucial
performance issues, that is, the places where devices in that profile
are most heavily stressed and the places where Linux absolutely has to
meet the usage demand. Hopefully, these will match the urgent questions
on your mind. However, we had to pick and choose here as well
and have chosen to concentrate on a few issues fully rather than
on many issues poorly.
- Run Tests to Address Those Key Issues
With these key issues in mind, we designed and ran tests to determine
just how well Linux performs. In each profile section below we give
you the pertinent data and as well as some discussion of the results'
implications.
- Run Low Level, General Tests
To cover the bases a bit better we also ran a standard suite of more
low level tests on every profile. These tests were not driven by
any particular issue but rather seek to provide more general data
that may be helpful for answering questions we weren't able to address.
The web/mail set-top appliance is a box which provides web and
email access at some fixed location. Examples include a box
that plugs into your television, a kiosk in a public place, or
the ever popular web-toaster.
| Profile Summary: |
| Application memory usage |
Decent, could even be improved with
framebuffer version of GUI toolkit |
| Application switch time |
Not great when one app quits and the other launches; much better when both apps are running and the switch is just a window redraw |
| Web browsing performance |
Very good, though results were gathered
with a non-production browser that couldn't test javascript |
| Mail sorting performance |
Good, though slower as the number of
messages increases |
| Conclusion: Linux performs quite
well on a web/mail device. The biggest concerns are memory
usage and switch time, but neither is insurmountable. |
Set-top appliances are non-portable devices, frequently with
network connections. Their hardware is similar to that of a low end
desktop computer, but their functionality is more specific than a
desktop's. To simulate the web/mail set-top we used an old desktop
computer with the following hardware:
- 166MHz Intel Pentium CPU
- 32MB of RAM
- 3Com 3c905 ethernet card
By comparison, the Philips Magnavox MAT976 has a 167Mhz R5231
processor (roughly comparable to the 166Mhz Pentium) and 16MB of RAM.
The memory difference between our generic device and this one is significant
until you consider that:
- This is a device out on the market right now; next year's model
will have bigger, better hardware (in fact, National Semiconductor's
SP1SC10 Set-top box reference platform diagram suggests 64MB of RAM).
- The software that runs on this device in only 16MB of RAM was
no doubt carefully engineered, integrated and optimized for that
specific task over a significant amount of time. Our version requires
more memory but we were able to throw together a functionally equivalent
set of applications and an operating system in a matter of days.
The web/mail appliance runs a stripped down Linux
kernel (version 2.4.14) without modules but with network support,
and a frame buffer console. It has a web application and an email
application, which use the same UI toolkit. We used a couple of open
source applications for the web and mail clients called Dillo
(http://dillo.sourceforge.net) and Stuphead (http://stuphead.asplinux.ru),
respectively. They are relatively small applications that use the GTK+
UI toolkit (http://www.gtk.org/).
In the coming pages we look at what we have identified as the key
issues for this profile:
- Application memory usage
- Application switch time
- Web browsing performance
- Mail sorting performance
In section A.1.2 of the appendix (go ![[*]](/usr/share/latex2html/icons/crossref.png) ), we
provide more generalized technical data about the performance of this profile. ), we
provide more generalized technical data about the performance of this profile.
One of the first questions on anyone's mind when it comes to embedded
software is "How much memory will it use?". Memory is a particularly
scarce resource in embedded systems and software running on them should
not squander it. The web/mail appliance runs two applications with
graphical user interfaces (which require significant memory) and one of
them is a web browser (a type of application well known for its memory
demands), therefore this question is particularly relevant.
- Methodology We measured the memory used by both programs
just after they started up and just after they had completed a normal
task (for the browser, loading www.amazon.com, and for the mail client,
opening the inbox, which contains 924 messages). We also measured the
memory usage of the X window system, the underlying display infrastructure
currently required to run these programs. Finally, we looked at the
amount of memory available on the entire system when both applications
were running.
For each program we started it, then ran 'ps axu' to collect the
data, then performed the "normal task", then ran 'ps axu' again. These
actions provided us with the application and X memory usage data. Then
we ran both applications simultaneously, had each perform its "normal
task" then ran 'free' to assess total memory usage.
- Results The web browser uses 2.8MB of memory after it
starts up. After loading www.amazon.com, it uses 4.2MB. The mail client
uses 3.2MB initially and 4.1MB opening the inbox. The X window system
consistently uses 7.7MB in each case. The entire system, after performing
these tasks, uses 19.7MB, leaving 12.3MB available.
The memory figures listed above are resident memory (physical
memory used). Memory use for each application is as follows:
| Dillo |
| |
Before |
After |
| Resident Memory |
2852k |
4312k |
| Virtual Memory |
5208k |
10,560k |
| Stuphead |
| |
Before |
After |
| Resident Memory |
3308k |
4172k |
| Virtual Memory |
5532k |
6312k |
| X Windowing System |
| Resident Memory |
7840k |
| Virtual Memory |
21,480k |
Entire system memory usage data was derived from the 'free'
command's output. The amount of free memory includes the memory
cache and kernel buffers (1444k available + 10,904 cached + 280k of
kernel buffers = 12,628k free). The amount of memory used is the
total free subtracted from the total physical memory (32,768k total
physical memory - 12,628k free = 20,140k). Please note that while
the space taken up by the memory cache is available for use, using
all of it and thus reducing the memory cache to nothing would
adversely affect the system's performance.
These memory usage figures are decent, particularly if you don't
take the X Windows memory usage into account. Our test apps are currently
written with GTK+ GUIs that require X Windows, but there are several
efforts afoot to make GTK+ work on the Linux frame buffer which would
make X Windows unnecessary.
All frame buffer versions of GTK+ are based on version 2.0 of
GTK+ whereas dillo and stuphead were written for 1.2 so we were unable
to determine just how much of a memory advantage frame buffer GTK+ would
confer on these programs. We did, however, look at how frame buffer GTK+
performs on a much simpler app we wrote ourselves. You can read more
about this in section A.2.1 of the appendix (go
).
The web/mail appliance does two things: browse the web and read/write
email. We can expect the user to switch between these two activities
frequently; the time it takes to switch applications should probably
not be noticeable, and should definitely not be annoying.
- Methodology In its worst case, application switch time
consists of the time it takes for one program to stop completely and
the other to start completely. To learn just how long it takes for
this to happen we added some code to our web browser and our mail
client to time initialization and shutdown time.
We linked dillo and stuphead to our timer library and timed from the
beginning of main() to the just before gtk_main(). We also timed
from the point at which the quit command is received to the end of
main(). We then ran each program ten times and reported the average
times. Each "run" of dillo consisted of starting the application,
loading www.amazon.com from the location bar, and quitting the application.
Each "run" of stuphead consisted of loading the application, opening the
inbox, and quitting the application.
- Results Switching from mail client to web browser takes
about .6 seconds. Switching from web browser to mail client takes
about 2.0 seconds. The former is quite acceptable, the latter a bit
slow owing to the mail application's long startup time.
Dillo's average start time is .50s and its average exit time is .14s.
Stuphead starts in 1.83s on average and averages .12s to shutdown.
A mail client to web browser switch is .62s (.12 + .50) and a web browser
to mail client switch is 1.97s (.14 + 1.83).
Application switch time on our web/media appliance is reasonable but
not great. However, we chose to test the worst case for application
switching, namely full shutdown of one application and full startup of
the other. Given that this device has 32MB of RAM, we can quite easily
run both applications at once so that an application switch becomes
changing which application's window is visible, thus reducing the time
to a fraction of what we listed above. We didn't test this type of
application switch, but based on the user interface redrawing figures
in section A.2.2 (go ), we estimate
application switch would take no more than .5 seconds and probably
closer to .2 seconds.
Web browsing performance is, naturally, a primary concern when designing
a web/mail appliance. Loading a web page is probably the most common
action that the users of this device will take. It is a serious
problem if this extremely common action takes more time than the user
expects it to (which, we can safely assume, is the amount of time it
takes on desktop or laptop computer).
It is very hard to pin down all the factors in a real world test
of web browsing because many of them (internet conditions,
remote web server performance, etc.) are beyond our control.
The numbers we provide here will give you ballpack estimates of
web browsing performance but they are still subject to the
vagaries of the real-world internet. Also, Dillo, our test web browser,
does not support javascript yet so we were unable to test the
impact of that technology on browsing performance.
- Methodology We added some timer code to the web browser to
let us know how long each page load takes. Then we tested how long it took
to load:
- an SSL protected shopping cart page at www.amazon.com (the cart
contained five items and the page was 35.6k in size)
- a very large archive of messages to a mailing list
(http://www.uwsg.indiana.edu/hypermail/linux/kernel/0108.2/index.html)
We added code to dillo such that the timer starts when the
"open url" request is received and elapsed time is read each time any
of the object handlers (html, plaintext, gif, jpeg, png, or cache)
finishes processing. We consider the last of these times after the
page is finished loading to be the time it took to load the page. We
loaded each of our test pages ten times, taking care that we were doing
a full reload rather than just getting the page from the browser cache
(debug messages didn't indicate that we were hitting the cache, and the
time it took to load the page did not decrease significantly over the ten
loads). The device is connected to the Internet via a DSL modem.
- Results The web browser loaded the www.amazon.com
shopping cart in 2.1 seconds. It loaded
http://www.uwsg.indiana.edu/hypermail/linux/kernel/0108.2/index.html
in 2.5 seconds.
That's 2.086 seconds, on average, for www.amazon.com and
2.495 seconds, on average for
http://www.uwsg.indiana.edu/hypermail/linux/kernel/0108.2/index.html.
Two to two and a half seconds is quite good for browsing web pages of this
complexity. It is comparable to the performance that we've seen loading
these pages on desktop machines with much better hardware. It should
thoroughly satisfy the user.
A mail client doesn't make the demands on the network connection that a
web browser does, so the most crucial performance issue a mail client
presents has to do with how it handles messages rather than how it sends
or receives them. The most strenuous task a mail client might be given
regularly is to sort the messages in a large mail folder. Sorting is one
of the most basic and universal problems in computer science and how well
a system solves it in a particular instance can greatly impact performance.
- Methodology Our mail client offers sorting by message number,
size, date, from, and subject. We chose to sort by subject in our tests
because it is the most difficult. We sorted two different mail folders, one
containing about 1,000 messages, the other containing about 10,000. We
added code to the mail client to tell us how long each sort took.
Initially we were going to test each sorting method (number, size,
date, etc.) but to simplify the process and the resulting data we chose
the sort that consistently took the longest: the sort by subject. We
created our test mail folders from the archives of two technical mailing
lists, one containing 924 messages in a total of 3590k, the other containing
9827 messages in a total of 37,962k. We added a timer to stuphead's sort
handling function that measures and reports the time elapsed in that
function. We then ran the sort 10 times on each mail folder and averaged
to get the values reported below.
- Results The mail client sorts almost 1,000 messages by
subject in .7 seconds. It sorts almost 10,000 messages by subject in
13.9 seconds.
924 messages were sorted in an average of .65 seconds, 9827 messages
in an average of 13.93 seconds. Simple, repetitive actions
like sorting large quantities of data rely heavily on OS basics like
file read bandwidth and memory bandwidth and latency. See section
A.1.2 of the appendix (go ) for these
and other basic details.
Sorting 1,000 messages in less than a second is a very reasonable result.
Increasing the number of messages tenfold leads to an significantly
slower operation. However, users appreciate that 10,000 messages is a
lot and that sorting them will take a noticeable amount of time.
The Personal Video Recorder (PVR)/Media Set-Top Appliance profile
contains non-portable devices that handle large quantities of media
effectively. Media input usually comes from a television tuner, a cable
box, a satellite dish, or the internet. The media is compressed,
stored on the device's large hard drive, then, at a later date,
uncompressed and played, probably on a television screen and/or through
speakers.
| Profile Summary: |
| Application memory usage |
Very good, but it doesn't take any
GUI elements into account |
| Disk performance |
Reasonable, though the results are fuzzy because
our method of simulating media streams was less than perfect |
| Program listing search performance |
Impressive, although the impact
of GUI drawing was not taken into account |
| Conclusion: Linux can handle the demands
of a PVR/Media device quite easily. The only concern we have is that
our disk performance tests do not perfectly simulate actual usage. |
Set-top appliance hardware is similar to that of a low end
desktop computer, but the device's functionality is more specific than a
desktop's. To simulate the PVR/media set-top we used an old desktop
computer with the following hardware:
- 166MHz Intel Pentium CPU
- 16MB of RAM
- Matrox Millenium II video card
- Western Digital WDC AC34300L Hard Disk
- Hauppauge WinTV tuner card
The Philips line of digital video recorders (models hdr212, hdr312,
and hdr612) (which can be used the with Tivo service) typify this
profile. They all come with PowerPC processors and hard drives large
enough to hold 20, 30, or 60 hours of MPEG-2 compressed video. It is
difficult to find published descriptions of the processor speed and
memory quantities of these devices, but the unofficial word on
www.tivocommunity.com is that the processor runs at 33Mhz and the
device has 16MB of RAM. We also suspect that these digital video
recorders have specialized hardware to handle the MPEG-2 encoding
and decoding that must be done to store 60 hours of video on a
reasonably sized disk.
There are discrepancies between our test device and what we consider
to be typical devices currently on the market. For one thing, our
processor is significantly faster. However, Tivo just announced
the next generation of digital video recorders and rumor has it
that the processors in them are in the 200MHz range. Also, the
processor on National Semiconductor's SP1SC10 set-top reference
platform is available in versions running as fast as 266MHz. Our
profile is ahead of what is currently on the market but it isn't that
far from what is around the corner.
Another discrepancy between our test device and those out on the
market is that we lack the specialized hardware dedicated to
MPEG-2 encoding and decoding that we assume digital video recorders
use (National Semiconductor's set-top reference platform, the SP1SC10,
includes an MPEG-2 decoder chip). As a result, we won't be performing
any MPEG-related performance tests. If most devices handle encoding
and decoding elsewhere, then it really isn't a Linux performance issue.
Our test hardware for this profile runs version 2.4.14 of the Linux
kernel with support for SGI's XFS filesystem (which was specifically
written to handle large quantities of media) with 4096 byte blocks.
It has modules for Ethernet, PPP support, sound support, video for
Linux, and a frame buffer console. To test the video capabilities
of this system we used fbtv, a small frame buffer based utility for
displaying video. Because this device requires a fairly simple user
interface, and because we looked a GUI considerations in the previous
profile we chose not to study user interface impact here. For a
description of a simple UI on similar hardware, please see section
A.2.1 of the appendix (go ).
In the coming pages we look at what we have identified as the key
issues for this profile:
- Application memory usage
- Disk performance
- Program listing search performance
In section A.1.3 of the appendix (go ),
we provide more generalized technical data about the performance of this
profile.
Memory usage is, as always, one of the primary questions
when it comes to embedded devices. Here we've looked at
how much memory it takes to display video (this includes extra
memory that the system uses as well as the application that
displays the media), how much memory it takes to move data
around in a manner consistent with simultaneously recording
one media stream (a television program, for instance) and viewing
a previously recorded one, and how much memory is left when all of
this is happening.
- Methodology We determined the amount of memory
necessary to record media and play media simultaneously, as well
as the memory necessary to display video. We also measured how
much memory is still available when all these things are happening
simultaneously.
We started the test program we wrote to simulate simultaneous
reads and writes (see the Disk Performance key issue, below), then
started fbtv, a program that displays the output from the tv tuner
card on the frame buffer. Finally, to collect the data, we ran
'ps axu' and 'free'.
- Results The media simulation takes 1.2MB, and video
display takes another 1.2MB. The whole system has 4.9MB free when
everything is running, meaning that 11.1MB is used.
The memory figures listed above are resident memory (physical
memory used). Memory use for each task is as follows:
| Media Simulation |
| Resident Memory |
1272k |
| Virtual Memory |
11,052k |
| Video Display |
| Resident Memory |
1264k |
| Virtual Memory |
18,436k |
Entire system memory usage data was derived from the 'free'
command's output. The amount of free memory includes the memory
cache and kernel buffers (1216k available + 3692k cached + 88k of
kernel buffers = 4996k free). The amount of memory used is the
total free subtracted from the total physical memory (16,384k total
physical memory - 4996k free = 11,388k). Please note that while
the space taken up by the memory cache is available for use, using
all of it and thus reducing the memory cache to nothing would
adversely affect the system's performance. Also, a better simulation
of a PVR device might not utilize virtual memory at all since it
creates a greater potential for lost data.
4.9MB of available space is quite good on a 16MB device that does
serious media work. The one caveat is that our test here involved
very little in the way of user interface and a nice GUI would take
up a little bit more room. See section A.2.1 of the appendix
(go for an idea of how much space a GUI would
take.
We did not test MPEG encoding and decoding because these
are most frequently handled by specialized hardware, but we did
look at disk performance in prior to and following MPEG operations.
We simulated a particularly stressful case: the one in which the
user is simultaneously recording one stream of media and playing
another, thus calling for lots of near-simultaneous disk reads and
writes.
- Methodology For this test we wrote a program to
read and write random data to and from the disk in a manner
consistent with media recording and playing. This program measures
the maximum rate at which the system can read and write, which
we then compare to the rate required for this application to
determine if the former is sufficient.
Our program had two threads, one that read frame sized
chunks (where framesize is determined by an assumed 6Mb/s bitrate
and a 30 frames/second framerate) of random data from a file in
an XFS filesystem and one that wrote frame sized chunks; both
continuing until 60 seconds had passed on the system clock. Each
thread kept track of how many "frames" it processed and also kept
running totals on the number of frames that took longer than 33
milliseconds to be processed. We ran the program 10 times and
averaged the results.
- Results Our test system was able to record media at
a rate of 43 frames per second and play back media at 45 frames
per second; rates that are well in excess of the 24, 25, and 30
frames per second frame rates employed in the most common video
standards (film runs at 24 frames per second, U.S. television at
30 frames per second).
The frame rates listed above are average rates; i.e., the
number of frames processed in 60 seconds divided by 60. To ensure
that we didn't have a large number of very slowly processed frames
counterbalanced by just a few incredibly quick ones, we collected
data on the distribution of frame processing speeds:
| Average Time Per Frame Distribution (Playback) |
| 0-9ms (111 fps) |
2657.8 frames |
| 10-19ms (53 fps) |
7.4 frames |
| 20-29ms (34 fps) |
14.7 frames |
| 30-39ms (25 fps) |
8.6 frames |
| 40-49ms (20 fps) |
0.7 frames |
| 50-59ms (16 fps) |
0.1 frames |
| 60-69ms (14 fps) |
0.4 frames |
| 70-79ms (13 fps) |
0.2 frames |
| 80-89ms (11 fps) |
0.1 frames |
| 90-99ms (10 fps) |
0.2 frames |
| 100+ms (< 10 fps) |
0 frames |
| Average Time Per Frame Distribution (Record) |
| 0-9ms (111 fps) |
1853.5 frames |
| 10-19ms (53 fps) |
14.4 frames |
| 20-29ms (34 fps) |
40.6 frames |
| 30-39ms (25 fps) |
345.9 frames |
| 40-49ms (20 fps) |
123.5 frames |
| 50-59ms (16 fps) |
39.0 frames |
| 60-69ms (14 fps) |
32.9 frames |
| 70-79ms (13 fps) |
29.4 frames |
| 80-89ms (11 fps) |
35.7 frames |
| 90-99ms (10 fps) |
31.8 frames |
| 100+ms (<
10 fps) |
33.3 frames |
The table above groups frames by the amount of time it took
them to be processed. This processing time is expressed in a
range like "20-29ms"; in the playback part of the test 14.7
frames, on average, took between 20 and 29 milliseconds to be
processed. The frame rate for those frames is the inverse of
time per frame. Thus, the slowest possible frame rate for
frames in that group is 34 frames per second (.029 seconds
per frame, inverted).
For playback we can see that, while there are some frames that
took longer than the required 29ms (which converts to 34 frames
per second, safely above the standard 30fps) they only
account for less than 1% of the total number of frames and
therefore are hardly cause for concern, particularly since over
two thirds of the frames were processed in under 10ms (which is
a frame rate of at least 111 frames per second).
For recording, the data are not as encouraging: about a quarter
of the frames processed took too long to be processed, with a
particularly significant group between 30 and 49ms, a range which
(at at least 20fps) is well under our target frame rate. We
mustn't underestimate that 70% of the frames that get handled
in at least 111 frames per second. With some caching there should
be plenty of extra time to deal with cached frames that we weren't
able to handle when they initially came in.
Simple, repetitive actions like reading and writing large
quantities of data rely heavily on OS basics like file read bandwidth
and memory bandwidth and latency. See section A.1.3 of the
appendix (go ) for these and other basic details.
These tests were performed with filesystem caching on.
In an application which processes large streams of data, caching does
not help performance and will eventually hinder it as the cache expands
to use as much memory as it can and creates conflicts with other memory
users. A more accurate simulation of a PVR device probably wouldn't have
caching turned on. However, the impact of caching on the read and write
performance figures above is probably relatively small since they
process stream data linearly and derive no performance benefits from
cached data.
Our test system handled the complicated and demanding case of
having to record and play simultaneously quite gracefully.
Apart from the media storage, these devices often store large
databases of metadata, that is, information about the media
available and/or stored on the device. Searching these data
can place a noticeable load on the system. We've measured
just how noticeable.
- Methodology
We created a large text file containing 10 days of 100
channels of 1 program every hour with a title, time, date,
description, and keyword list for every program. We searched
this primitive and inefficient "database" with a basic UNIX
command, looking for all entries containing "car" in the title,
keywords or description, all the programs being shown at 8PM on
the third day, and everything shown on channel 39 on the eighth day.
The "database" (a file called "program_listing") is a series of
entries where each entry is on its own line and has the format:
< program title > :
< program title > :
< channel > :
< hour > :
< day > :
< month > :
< year > :
< description > :
< keywords >
The program title, description, and keywords are randomly generated text,
the channel ranges from 0 to 99, the hour from 0 to 23, the day from 0 to 9,
and the month and year are fixed at 4 and 2001. The three searches
are grep commands: 'grep car program_listing', 'grep :[[:digit:]]*:20:2:
program_listing', and 'grep :39:[[:digit:]]*:7: program_listing'.
We used the time command to determine how long each search took. We
ran each search 10 times and averaged the results.
- Results As it turns out the three searches take nearly
the same amount of time. The "car" search took 2.1 seconds, the "8PM
on the third" search took 1.8 seconds, and the "channel 39 on the eighth"
search took 1.7 seconds.
Interestingly, most of the variation in search times appears
to come from the number of results displayed. The "car" search, which
comes up with 521 matches, only takes 1.8 seconds (rather than 2.1) if
those results are not displayed (grep output is directed to /dev/null).
The "8PM on the third" search gets 100 matches and takes 1.7 seconds
rather than 1.8 if the results are not displayed. The "channel 39 on
the eighth" search gets only 24 matches and takes 1.7 seconds whether
it displays them or not. So it appears that devices can keep their
search times relatively constant if they can keep their display time
from depending too much on the number of matches. It is also worth
noting that these data were collected in a text only environment and
do not take into account the extra time that GUI drawing requires.
Results drawing time should stay roughly constant however, since only
the number of results that can fit on the screen will actually be
drawn, regardless of how many matches are found. For more information
on GUI drawing times, see section A.2.2
of the appendix (go ).
About two seconds to do a primitive search through approximately 10MB
of data should be acceptable to the user. Better organized data could
be searched more quickly but even at these speeds (not quite instantaneous
but not a long wait for a search) there should be no complaints.
Our device profiles have plenty of differences, but they also
share similarities. We ran a standard set of tests on every profile,
not because we expect you to compare the number from profile to profile
but because there are certain, pertinent measurements to be taken on
any device running Linux. In this next section we'll tell you where
these numbers came from and how they are useful. In the following sections
we'll give you the results for each profile.
- Kernel Measurements
- Basic numbers on the kernel and associated modules.
- Kernel size
- The size of the kernel image; i.e. how much static storage the Linux
kernel itself requires. Some profiles will list this number for a
compressed kernel image only, others will list both compressed and
uncompressed sizes.
- Module size
- The sum total size of all possible modules that may or may not
be loaded into the kernel at any given point. This figure was
determined by determining the size of the contents of the
/lib/modules/kernel name/kernel directory.
- Kernel RAM usage
- How much dynamic memory the kernel requires to boot plus any extra
memory it initially allocates for its own uses. We measure kernel
memory usage only, not cache, not user space. This value was
determined by examining /proc/meminfo immediately after booting and
subtracting the MemTotal value from the total memory available.
- Boot time
- How much time it takes from when the kernel is started to when the
device is ready for user input. This does not include any hardware
startup time or the time it takes to decompress the kernel. We have
broken down this measurement into three numbers: time elapsed before
root partition is mounted, time elapsed before the init process is
started, time elapsed before login prompt. These values were collected
by directing console output over a serial port and timing the arrival
of key strings on the other end.
- Bandwidth and latency
- LMbench is a set of relatively simple, portable benchmarks for
Unix operating systems. We used several LMbench tests to gather
data on bandwidth and latency in various contexts. For each test
we list below a description and the lmbench test name in parentheses.
For more information on LMbench, see http://www.bitmover.com/lmbench/.
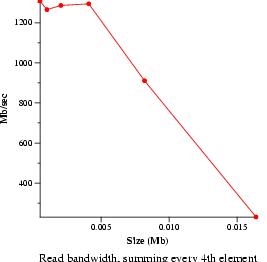
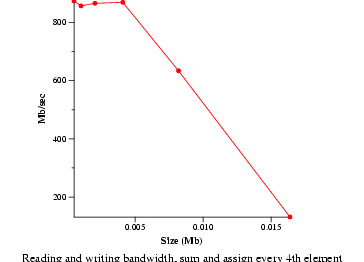
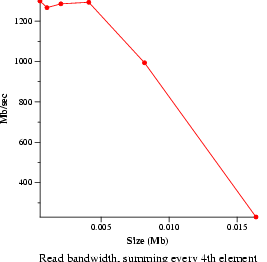
- File read bandwidth (bw_file_rd)
- Measure file reading and summing speeds. Data will be presented as an
average.
- Pipe bandwidth (bw_pipe)
- Measure maximum data rate through pipes. Data will be presented
as an average.
- Socket bandwidth (bw_unix)
- Measure data movement through Unix stream sockets. Data will be
presented as an average.
- Named pipe latency (lat_fifo)
- Measure time it takes to pass a token between processes via a
named pipe. Data will be presented as an average.
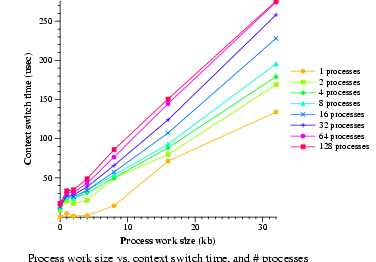
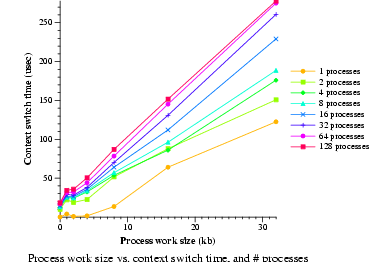
- Context switch latency (lat_ctx)
- Measure context switch time. Data will be graphed.
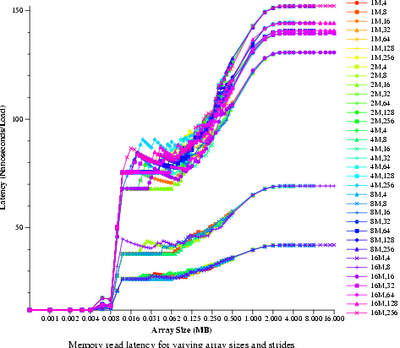
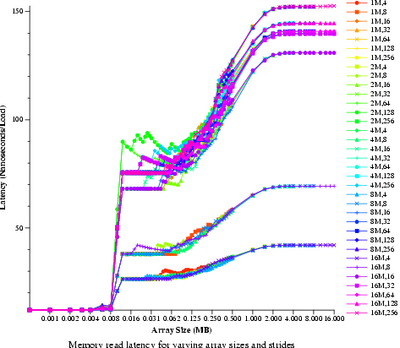
- Memory read latency (lat_mem_rd)
- Measure the time it takes to do a single memory read. Data will
be graphed.
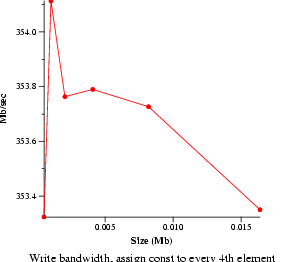
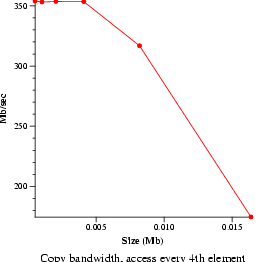
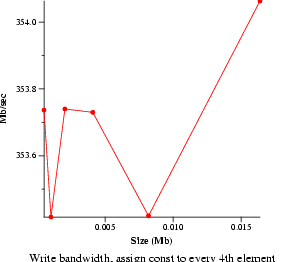
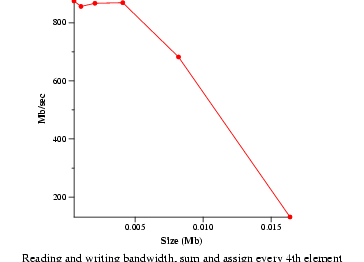
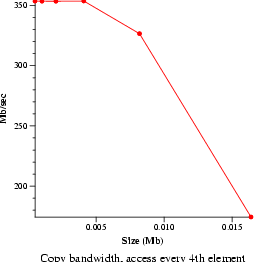
- Memory bandwidth (bw_mem)
- Measure memory read, write, and copy speeds. Data will be graphed.
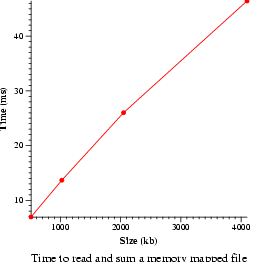
- Memory map bandwidth (bw_mmap_rd)
- Measure the speed of reading and summing a memory mapped file.
Data will be graphed.
A..1.2 Web/Mail Set-Top Profile Standard Measurements
| Kernel measurements |
| Kernel size |
1668k uncompressed |
| |
615k compressed |
| Modules size |
0k |
| Kernel RAM usage |
2140k |
| Boot time |
7.6s to root mount |
| |
8.3s to init |
| |
18.5s to login |
| Bandwidth and latency averages |
| File read b/w |
280.74 MB/s |
| Pipe bandwidth |
41.1767 MB/s |
| Socket bandwidth |
30.9833 MB/s |
| Named pipe lat. |
28.867933 usecs |

A..1.3 PVR/Media Set-Top Profile Standard Measurements
| Kernel measurements |
| Kernel size |
2975k uncompressed |
| |
935k compressed |
| Modules size |
336k |
| Kernel RAM usage |
2764k |
| Boot time |
8.7s to root mount |
| |
9.3s to init |
| |
20.4s to login |
| Bandwidth and latency averages |
| File read b/w |
263.9633 MB/s |
| Pipe bandwidth |
41.5267 MB/s |
| Socket bandwidth |
30.58 MB/s |
| Named pipe lat. |
31.007467 usecs |
When running the Web/Mail Profile tests, we tried out three
different varieties of GTK+: the standard flavor that runs on top of
X Windowing System (thus incurring some serious memory use), GtkFB,
which runs without X on the frame buffer, and GTK+ DirectFB which also
runs on the frame buffer via the DirectFB library
(http://www.directfb.org/). These data didn't fit well into any of the
key issues, but they may be useful to those who are especially curious
about the various GUI options and the resources they require. It is also
worth noting that GTK+ is not the only game in town: Qt/Embedded and
PicoGUI are a couple of other worthwhile toolkits that we might have
studied further.
A..2.1 Memory Usage with Various Flavors of GTK+
To compare the memory usage of these different types of GTK+ we first
ran a very simple program (the Hello World example that comes with
GTK+) which just creates a window with a single button. We measured
the memory usage of this program when compiled with each of the different
types of GTK+.
| Plain GTK+ |
| Resident Memory |
5084k |
| Virtual Memory |
8972k |
| GtkFB |
| Resident Memory |
3344k |
| Virtual Memory |
6556k |
| DirectFB |
| Resident Memory |
5020k |
| Virtual Memory |
16,224k |
Gtkfb is clearly the big winner here, though it is, of course, still
under development and not nearly as stable as the original GTK+. Keep
in mind that the hard memory requirement is the resident memory amount,
though systems with very little free memory will experience serious
performance problems.
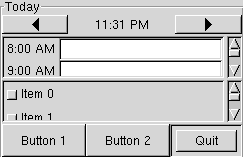
A..2.2 Application Speed with Various Flavors of GTK+
We wrote a small program with a slightly more complex UI to compare
time performance (see screenshot below). It gathers data in the
following categories:
- Window Construction: Timer stops before screen is constructed.
- Screen Construction: Timer stops before screen is displayed.
- Screen Draw: Timer doesn't start until after screen has been
constructed and stops when it has been fully drawn.
- Screen Redraw: Redraw happens after a full exposure.
- Window Destruction.
- Input Event: Measures from injection of event to invocation
of handler for that event.
- Unhandled Input Event: Measures from injection of event to
return to the UI event loop.
We ran our test application ten times in each case.
we report the results of the first run and the average of rest
separately because they are significantly different in some cases.
| GTK+ |
| |
first run |
average |
| Window construction |
426412 usecs |
244147.11 usecs |
| Screen construction |
4470473 usecs |
796923.44 usecs |
| Screen draw |
2850939 usecs |
324545.44 usecs |
| Screen redraw |
159176 usecs |
158092.33 usecs |
| Screen destruction |
216951 usecs |
130221.44 usecs |
| Input event |
100 usecs |
101.56 usecs |
| Unhandled input event |
163 usecs |
189.33 usecs |
| GTKfb |
| |
first run |
average |
| Window construction |
1448602 usecs |
217065 usecs |
| Screen construction |
422006 usecs |
229435.22 usecs |
| Screen draw |
1991443 usecs |
1967177.33 usecs |
| Screen redraw |
583035 usecs |
584324.11 usecs |
| Screen destruction |
117799 usecs |
117797.56 usecs |
| Input event |
98 usecs |
151.67 usecs |
| Unhandled input event |
158 usecs |
161 usecs |
| GTK+ DirectFB |
| |
first run |
average |
| Window construction |
1457777 usecs |
264295.11 usecs |
| Screen construction |
496140 usecs |
257655.44 usecs |
| Screen draw |
1163372 usecs |
1100969.89 usecs |
| Screen redraw |
183907 usecs |
184803.89 usecs |
| Screen destruction |
112138 usecs |
112072.44 usecs |
| Input event |
90 usecs |
92.56 usecs |
| Unhandled input event |
142 usecs |
142.78usecs |
GTKfb leads the pack in average screen and window construction, though
the first window it draws takes a ridiculously long time (this is true
of DirectFB as well and therefore could be a frame buffer related issue).
GTK+ is the fastest screen drawer and redrawer, though its first screen
draw isn't very fast relative to the frame buffer versions. The frame
buffer versions are consistently better than GTK+ at window destruction.
Finally, DirectFB excels at zippy event handling.
|